Many great articles came out about Water Activity in Green Coffee. Some of them are scientific, some of them are more approachable, some of them are giving a basic understanding, most of them don't give you a clue what to do either during the roasting or handling shipping/storage.
The one lecture I was inspired by to write about Water Activity, after years of using devices such as Pawkit, Lighttells and LeBrew, is the video from our beloved Mike Strumpf (LINK HERE).
Two other ones are incredible PDF documents from Ian Fretheim from Cafe Imports (LINK HERE) and Yimara Martinez Agudelo from Sustainable Harvest (LINK HERE).
For decades, the coffee industry has operated on a single, seemingly sufficient metric for green coffee stability: moisture content. We dry to 10–12%, check the reading with a capacitive meter, and assume the green coffee is safe. It’s a comfortable routine, but it’s incomplete. Moisture content tells you how much water is in the bean. It tells you nothing about what that water is doing.
That missing variable is Water Activity (aW).
While moisture content is a quantitative measure of weight, water activity is a thermodynamic measure of energy. It defines the availability of "free" water to drive chemical reactions, support microbial growth, and dictate how a bean responds to heat. For the serious roaster or importer, ignoring aW is like trying to bake a cake by weighing the ingredients but ignoring the oven temperature. You might get something edible, but you’ll never achieve consistency or unlock peak potential.
This isn’t theoretical. It’s the practical difference between a lot that stays vibrant for 18 months and one that turns "baggy", "old crop" in six. It’s the reason two coffees with identical moisture readings can roast in completely different ways. Here is what the data says, and how you can use it.
To understand aW, you have to look at the water inside the seed. It’s not all the same.
Water Activity measures the ratio of the vapor pressure of this free water in the bean to the vapor pressure of pure water at the same temperature.
aW=PP0aW=P0P
Think of it this way: Moisture content is the size of your fuel tank. Water activity tells you if the engine can actually access that fuel. You can have a bean with 11% moisture that is biologically dormant (low aW), and another at 11% that is actively degrading (high aW). The difference is the energy state of the water.
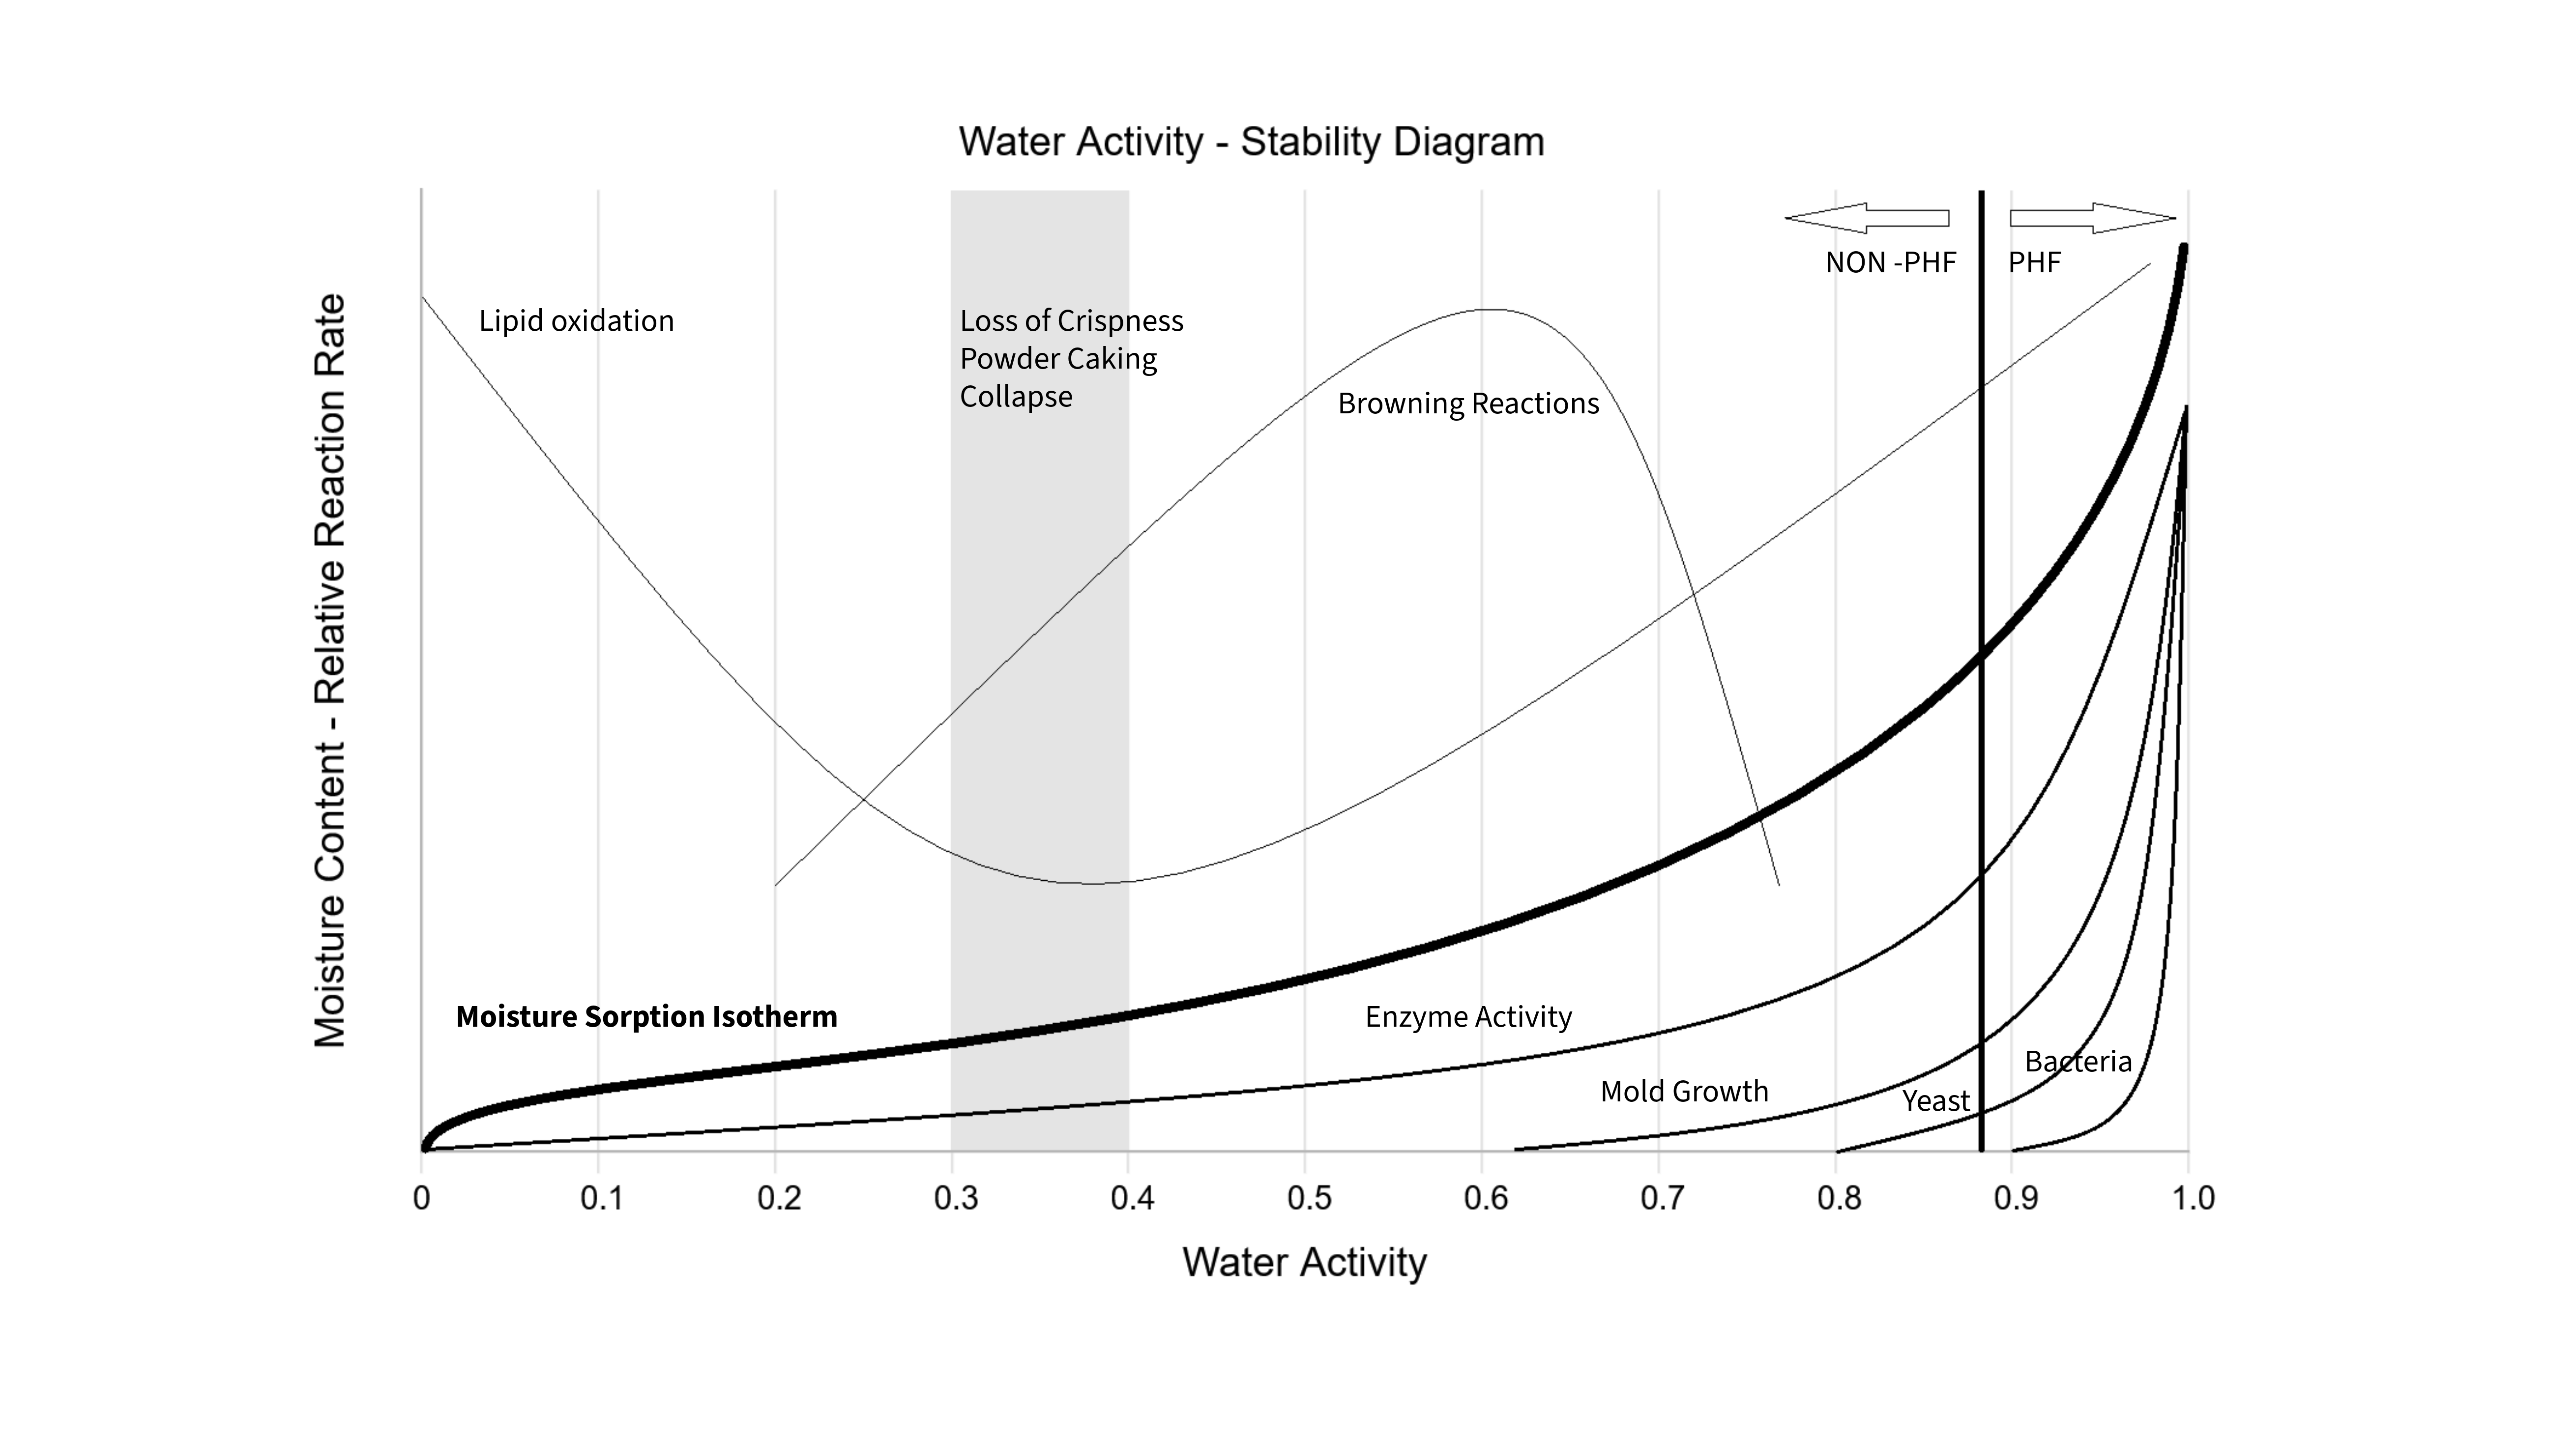
The relationship between aW and degradation isn’t linear; it’s a curve. Industry research, including longitudinal studies from major importers, points to a specific "safe zone" for green coffee (LINK HERE)
When green coffee sits between 0.45% and 0.55% aW, it is in a state of maximum metabolic stability.
In this range, coffee can maintain its cup score and aromatic complexity for a year or more, provided storage conditions are decent.
If you think aW is just for warehouse managers, think again. The energy state of water in the green bean fundamentally changes how it roasts.
Water is a heat sink. It takes energy to turn liquid water into steam.
The availability of free water influences reaction kinetics.
If you’ve ever struggled to replicate a profile on a new lot despite "perfect" moisture specs, aW is likely the culprit.
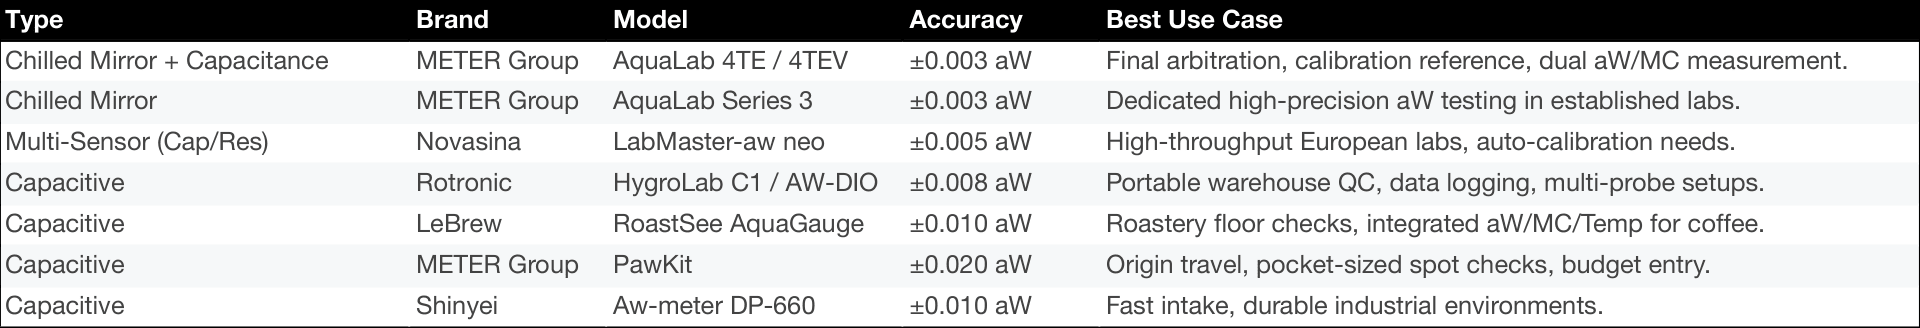
You don’t need a PhD to measure aW, but you do need the right tool for the job.
Practical Advice: If you’re serious, get a hybrid setup. Use a high-end Dew Point meter as your reference to check your portable capacitive meters. Use the portables for daily workflow.
Integrating aW doesn’t mean overhauling your entire operation overnight. It means adding one layer of data to your existing protocol.
1. Buying and Importing
Stop looking at moisture content in isolation. Push for dual specs: 10.5% – 11.5% MC AND 0.45% – 0.55% aW. If a producer dries slowly and evenly, they probably hit this target. If they rush drying, or weather is unpredictable, they might hit 11% MC but end up with unstable aW. Use aW to communicate the state of green coffee or prioritize shipping. High aW coffee should be roasted first.
2. Warehouse Management
Coffee is hygroscopic. If your warehouse is 70% RH and your coffee is equilibrated to 50% RH (0.50 aW), the coffee will absorb water. Keep storage cool (17–20°C) and humidity stable (50–60% RH). Use hermetic packaging (GrainPro, foil liners, vacuum, freezer) for anything you plan to hold longer than 3 months. Check aW monthly. If you see the number creeping up, move that lot to the front of the queue.
3. Roasting Adjustments
Check aW 12-24 hours before roasting so the sample equilibrates.
Water activity is the silent variable that connects farming, logistics, and roasting. It explains why some coffees survive long transits with their brightness intact, while others arrive stale despite "perfect" moisture numbers.
When you understand the energy state of your green coffee, you stop fighting the green coffee and start working with it. That’s where consistency comes from. That’s how you get the most out of every single roast.
Looking to integrate water activity into your workflow? Reach out to us for recommendations on equipment or consult on building a QC protocol that works for your scale.
